PulseAugur
中
实时 03:02:13
English(EN) A Unique Way To Visualize Expectations In Probability Theory

概率论:通过生存曲线面积可视化期望值

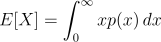
本文探讨了一种在概率论中可视化期望值的替代方法。它提出将随机变量的期望值解释为其生存曲线下的面积,该面积代表变量超过某个阈值的概率。作者通过连续型和离散型随机变量演示了这一概念,展示了生存函数下的面积如何产生与传统计算方法相同的期望值。 AI

排序理由 该集群包含一篇讨论新颖数学概念的学术论文。[lever_c_demoted from research: ic=1 ai=0.1]

在 Towards AI 阅读 →

AI 生成摘要 · Google Gemini · 来自 1 个来源。 我们如何撰写摘要 →
概率论:通过生存曲线面积可视化期望值

本文如何被排名

Signal score
0 / 100
Composite score across the factors below. Higher = stronger signal that this story matters right now.
Newsworthiness bucket
Tool
该集群包含一篇讨论新颖数学概念的学术论文。[lever_c_demoted from research: ic=1 ai=0.1]
Source corroboration
Single-source cluster
Only one publisher covered this so far. Single-source stories can still rank when the publisher is high-authority, but they lack cross-source corroboration.
Topics
paper
Editorial topic classification. Feeds into how the story surfaces on /topic/<slug> hub pages and into the per-entity coverage mix.
AI-industry relevance
Low
Off-topic or adjacent — cluster remains reachable but doesn't surface in AI-industry rankings.
Story freshness
107 days old
Aged out of breaking-news scoring windows; ranking reflects the durable signal from the full source set.

完整方法见我们的编辑标准。

报道来源 [1]

  1. Towards AI TIER_1 English(EN) · Kanishk Raj Tanwar ·

    概率论中可视化期望的独特方法

    <p>The concept of the expected value or the expectation of a random variable plays a central role in probability theory. It is usually interpreted as the average value of the random variable that we expect to see in a large number of independent repetitions of the experiment. It’…