PulseAugur
实时 15:51:21
English(EN) I Sketch Every Power BI Report in Figma Before Touching the Data

数据分析师在编码前于Figma中绘制Power BI报告

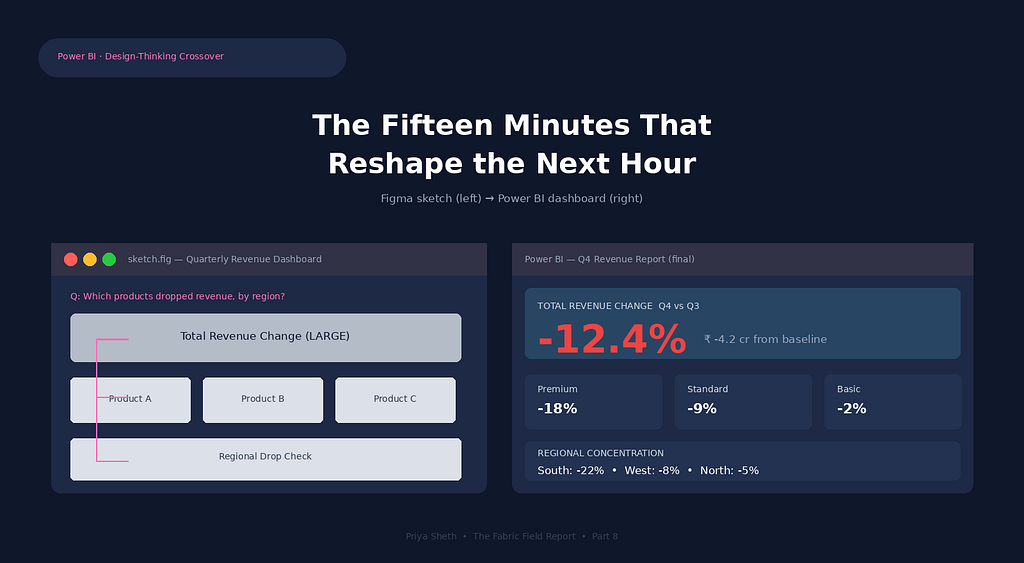
一位数据分析师提倡在构建Power BI报告之前,使用Figma或纸质草图进行初步设计阶段。该方法包括定义一个核心问题,概述基本信息层级,创建数据元素的低保真灰盒表示,并绘制清晰的阅读路径。作者认为,这个为期十五分钟的过程可以显著减少利益相关者的迭代周期,并防止创建不必要或令人困惑的报告。 AI

影响 本文讨论了数据可视化设计的工作流程,这与AI工具有间接关系,但并非核心AI新闻。

排序理由 本文是个人关于工作流程的观点文章,而非产品发布或重要的行业事件。

在 Towards AI 阅读 →

AI 生成摘要 · Google Gemini · 来自 1 个来源。 我们如何撰写摘要 →

数据分析师在编码前于Figma中绘制Power BI报告

报道来源 [1]

  1. Towards AI TIER_1 English(EN) · Sheth Priyanka ·

    I Sketch Every Power BI Report in Figma Before Touching the Data

    <h4><em>Fifteen minutes of paper-and-pixel work that saves me a week of stakeholder iteration cycles — and the UI/UX principles I quietly borrow from my past life.</em></h4><p>A dashboard I shipped two years ago opened with twelve KPI cards on the front page.</p><p>Twelve. All co…