本文用通俗易懂的方式解释了日常生活中遇到的七种常见分布,旨在无需复杂数学即可理解。另一篇文章讨论了数据可视化过程中约束的重要性,强调了它们在有效设计中的作用。 AI
影响 对AI运营的直接影响很小;侧重于基础数据概念和可视化原则。
排序理由 文章讨论的是与数据和可视化相关的通用概念,而不是特定的AI发布或开发。
在 Mastodon — mastodon.social 阅读 →
AI 生成摘要 · Google Gemini · 来自 2 个来源。 我们如何撰写摘要 →
本文用通俗易懂的方式解释了日常生活中遇到的七种常见分布,旨在无需复杂数学即可理解。另一篇文章讨论了数据可视化过程中约束的重要性,强调了它们在有效设计中的作用。 AI
影响 对AI运营的直接影响很小;侧重于基础数据概念和可视化原则。
排序理由 文章讨论的是与数据和可视化相关的通用概念,而不是特定的AI发布或开发。
在 Mastodon — mastodon.social 阅读 →
AI 生成摘要 · Google Gemini · 来自 2 个来源。 我们如何撰写摘要 →
完整方法见我们的编辑标准。
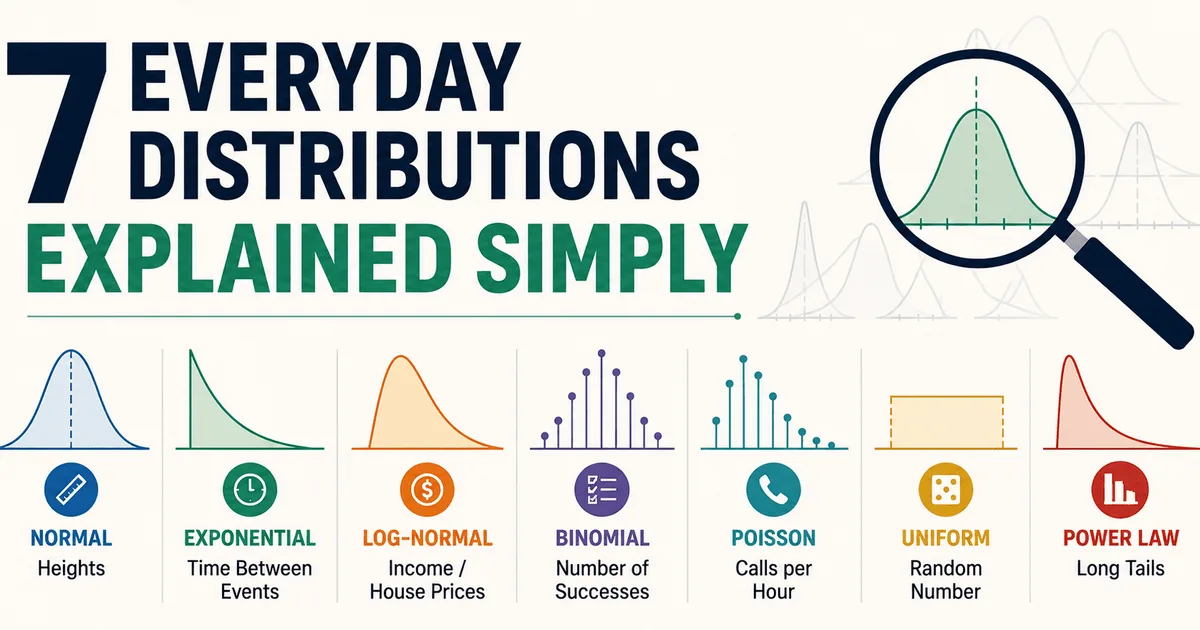
📰 7 Everyday Distributions Explained Simply This article is a quick, everyday tour of seven distributions you'll actually recognize once you know what to look for. No heavy math. No gatekeeping. 📰 Source: KDnuggets 🔗 Link: https://www.kdnuggets.com/7-everyday-distributions-explai…
📊 ✚ Restraint in the visualization process This week is about constraints.Tags: constraints 📰 Source: FlowingData 🔗 Link: https://flowingdata.com/2026/05/07/process-387-restraint/ # DataViz # AI # ArtificialIntelligence