PulseAugur
EN
LIVE 23:48:14

Learn AI Data Visualization with Python and Matplotlib

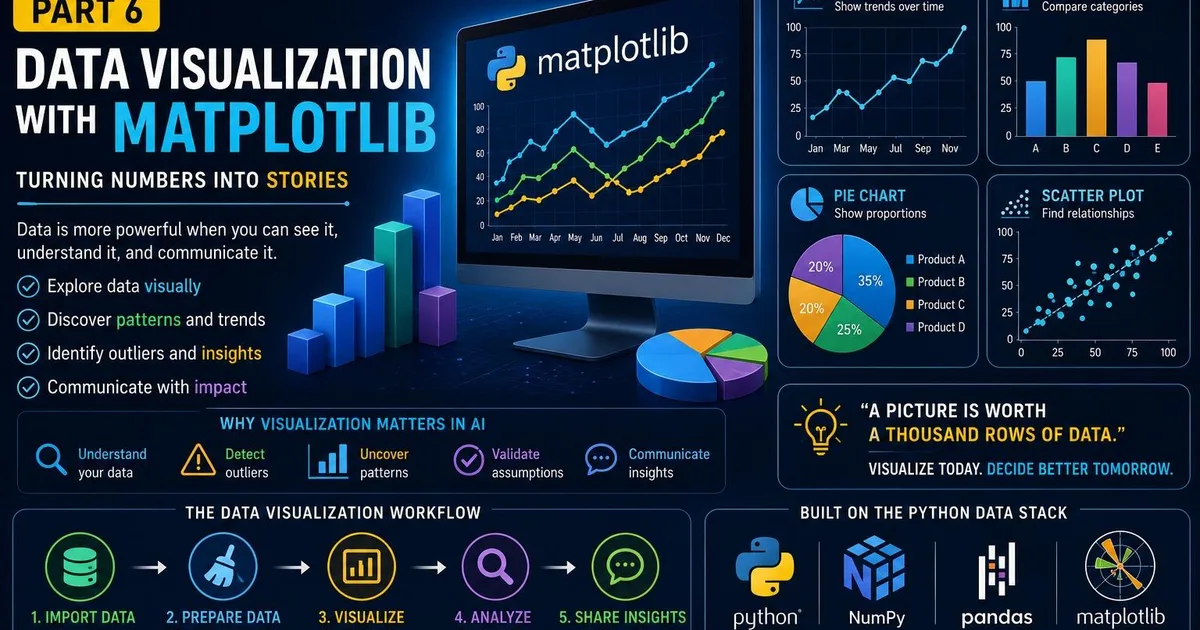
This article is the sixth part of a series on "AI With Python 2026" and focuses on data visualization techniques. It explains how to use the Matplotlib library in Python to transform numerical data into visual charts, enabling a better understanding of patterns and preparation of datasets for AI applications. AI

IMPACT Learn how to visualize data for AI applications using Python and Matplotlib.

RANK_REASON The item describes a tutorial on using a specific software library for a particular task.

Read on Mastodon — sigmoid.social →

AI-generated summary · Google Gemini · from 1 sources. How we write summaries →

Learn AI Data Visualization with Python and Matplotlib

COVERAGE [1]

  1. Mastodon — sigmoid.social TIER_1 English(EN) · [email protected] ·

    AI With Python 2026 (Part 6) Numbers tell you what happened. Charts help you understand why. Learn how to use Matplotlib to visualize data, uncover patterns, an

    AI With Python 2026 (Part 6) Numbers tell you what happened. Charts help you understand why. Learn how to use Matplotlib to visualize data, uncover patterns, and prepare datasets for AI. Read: https:// abkarikari23.tech/ai-with-pyth on-2026-part-6-data-visualization-with-matplotl…