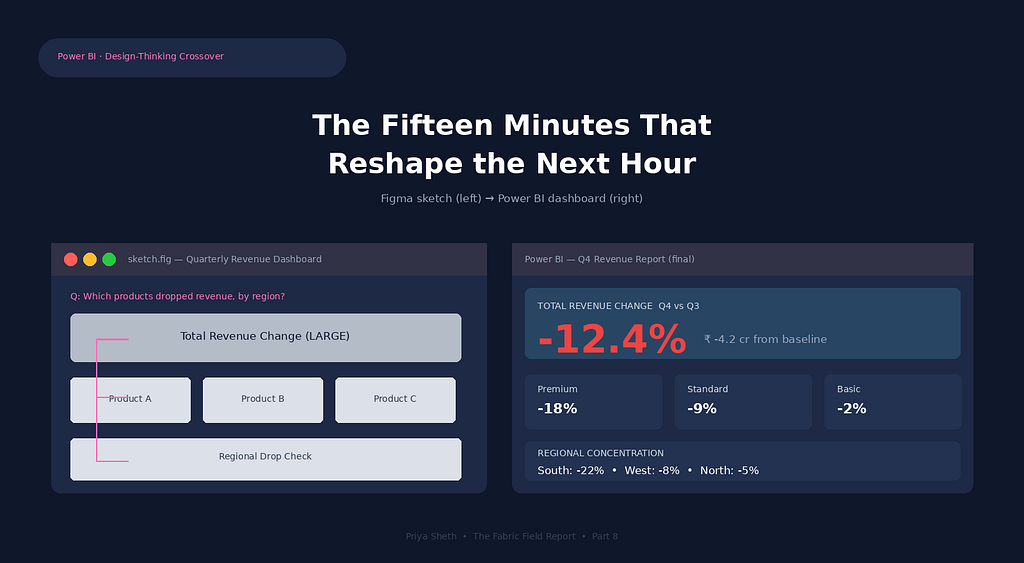
A data analyst advocates for a preliminary design phase using Figma or paper sketches before building Power BI reports. This approach involves defining a single core question, outlining the essential information hierarchy, creating low-fidelity grey box representations of data elements, and sketching a clear reading path. The author argues that this fifteen-minute process significantly reduces stakeholder iteration cycles and prevents the creation of unnecessary or confusing reports. AI
IMPACT This article discusses a workflow for designing data visualizations, which is tangentially related to AI tools but not core AI news.
RANK_REASON The article is an opinion piece from an individual about a workflow, not a product release or significant industry event.
AI-generated summary · Google Gemini · from 1 sources. How we write summaries →