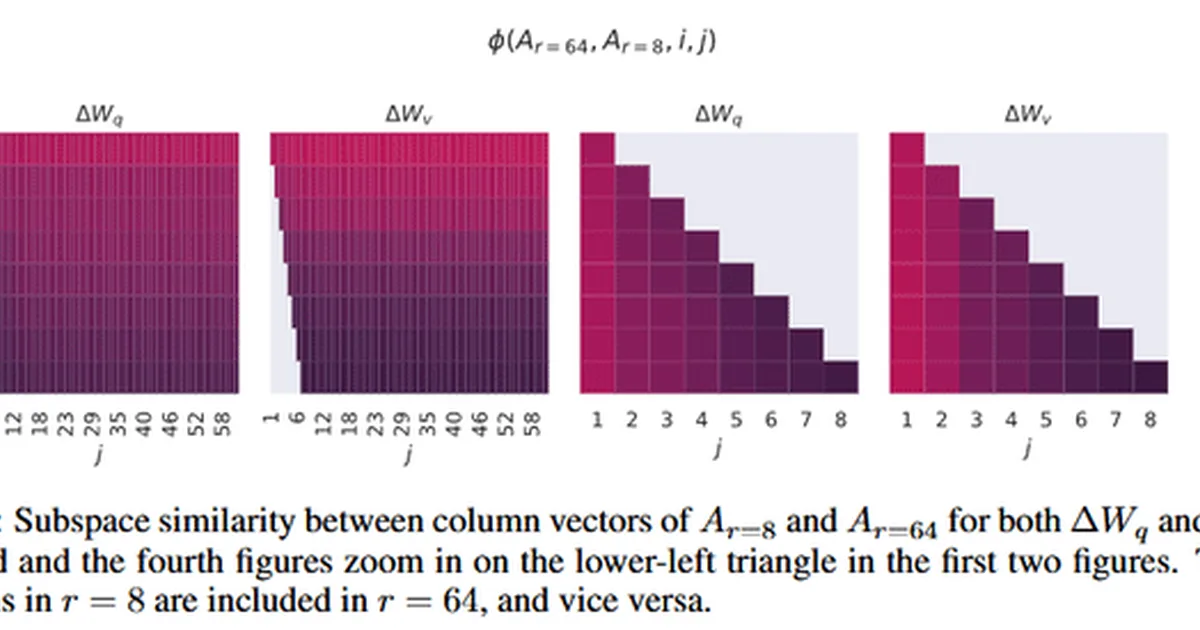
A user on the r/MachineLearning subreddit is seeking clarification on a specific figure within the LoRA paper. The figure illustrates subspace similarity, measuring the containment of vectors from one subspace within another. The user is confused about how the provided plots represent cases where the number of vectors in the target subspace (j) is less than the number of vectors in the source subspace (i), and is questioning the y-axis interpretation of the rightmost figures. AI
IMPACT Clarifies a specific technical detail within a research paper for practitioners.
RANK_REASON User-generated question about a research paper figure, not a primary source release or analysis.
AI-generated summary · Google Gemini · from 1 sources. How we write summaries →