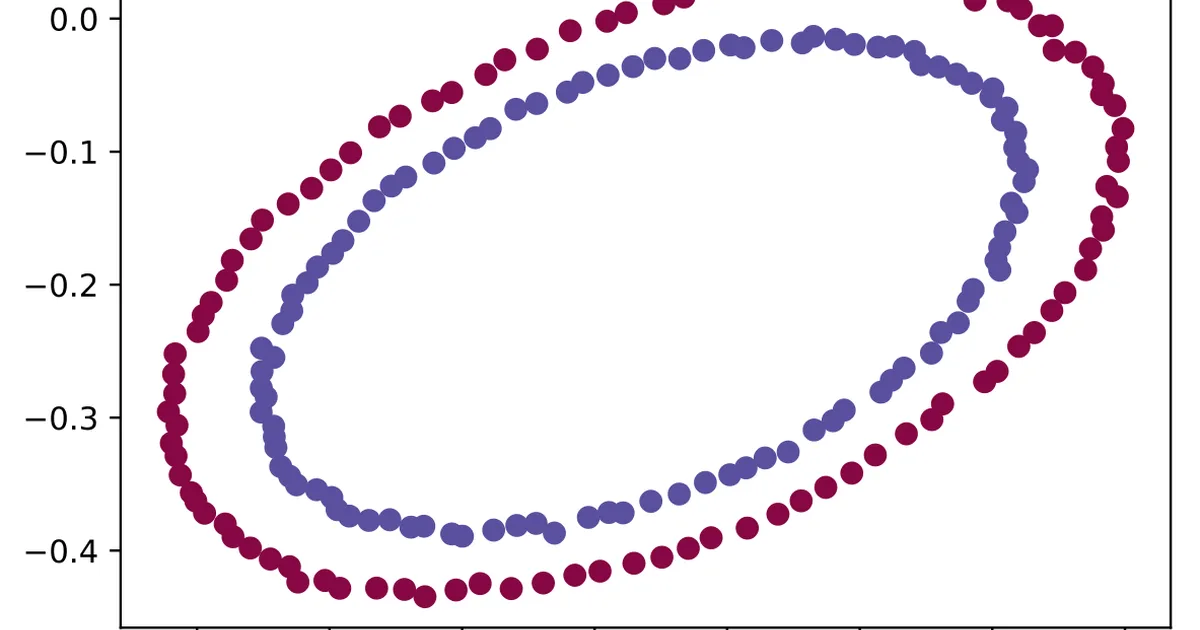
An animation demonstrates how non-linearly separable data can become linearly separable through the use of a small non-linear layer in a machine learning model. The visualization shows the optimization process of random weights leading to a linearly separable solution for a "two circles" toy dataset. This process involves a minimal non-linear layer, a 2D projection for visualization, and a logistic regression classifier. AI
RANK_REASON The item is a personal social media post about a self-made animation illustrating a machine learning concept, not a primary source release or significant industry event.
Read on Mastodon — sigmoid.social →
AI-generated summary · Google Gemini · from 1 sources. How we write summaries →